Well, it’s the time of year again when I write my year in review blog post. This year I am feeling a bit like Bill Murray in the 1993 film Groundhog Day. It’s been a wild year! But I’ve said that every December for the last three years and no doubt it has been warranted. This year was brutal for investors, with very few places to hide when it came to investments. Traditional assets categories like stock and bonds got hammered. In fact, this year was the worst for a traditional 60/40 portfolio since the 1930’s. Unless you had significant exposure to energy and commodities, you are most likely down on the year.
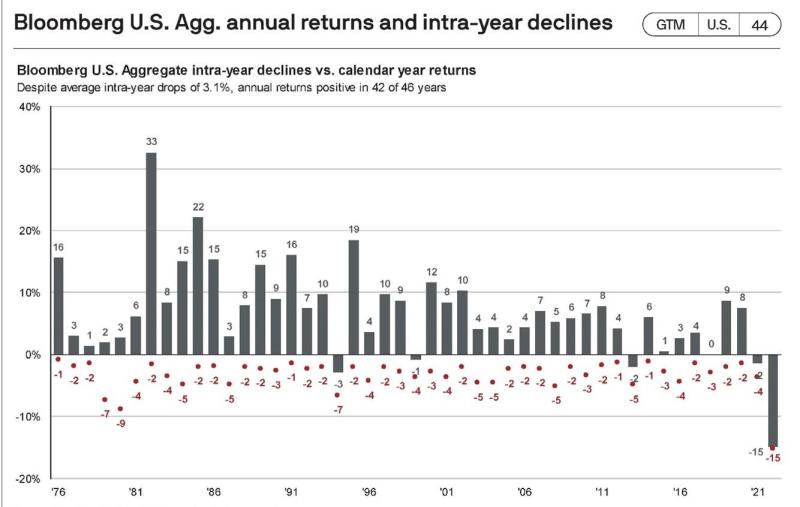
The Aggregate Bond Index in the US is on pace for its worst year since the 1930’s (this is what makes up that 40% in the 60/40 portfolio). The chart below shows just how bad things have been for the “conservative” asset class: the grey bars show the total return for the index on a calendar year basis and the red dots show the deepest drawdown experience in that year. To say 2022 is an outlier would be an understatement.
Of course, all this turmoil in financial markets is being caused by the Federal Reserve’s aggressive approach to taming the highest inflation our economy has faced in over four decades. Interest rates themselves have never risen this fast before. Sure, rates have gone from 5% to 10% quickly, but never from 0% to 5%. Prior to the 21st century interest rates had never been below 5% for an extended period, ever. And the history of interest rates is long, going back thousands of years. As always in finance and economics relative change is what matters most. While 5 to 10 is an increase of 100%, 0.1 to 5 is +4,900%.
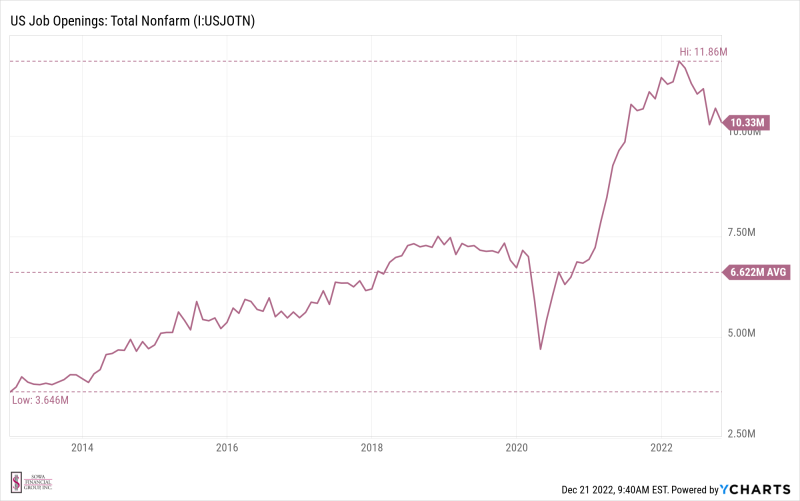
The big difference between today’s inflation and the last time prices rose significantly is the state of the labor market. During the late 1970’s unemployment was a serious problem, while today the opposite is true. In fact, according to the federal government, there are 1.7 job openings per unemployed person in the US today. The unemployment rate currently sits at 3.7% and we’ve now experienced 23 consecutive months of job growth. The chart below shows that we are still well above the 5-year average for job openings.
Another asset class that has been showing signs of weakness has been housing. This was to be expected as prices increased dramatically over the last two years and interest rates have risen quickly. The chart below shows the 30-year mortgage rate and the Case-Shiller home price index in the US over the last 10 years. Clearly, higher mortgage rates are not great for home values.
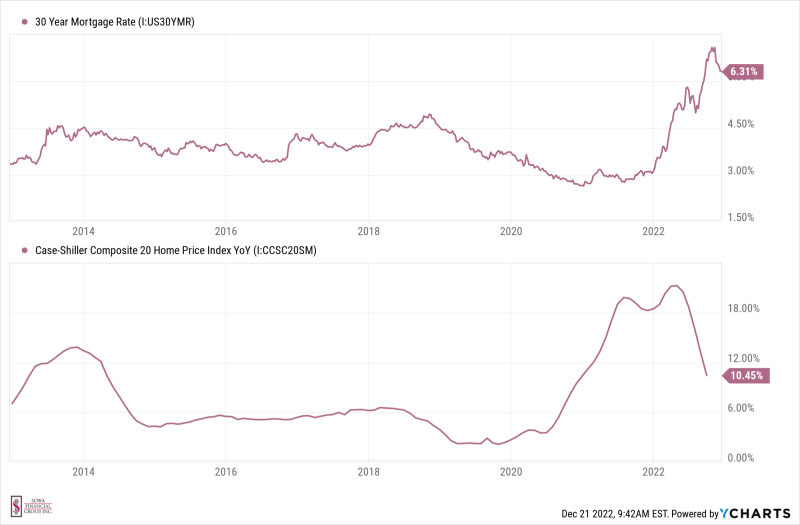
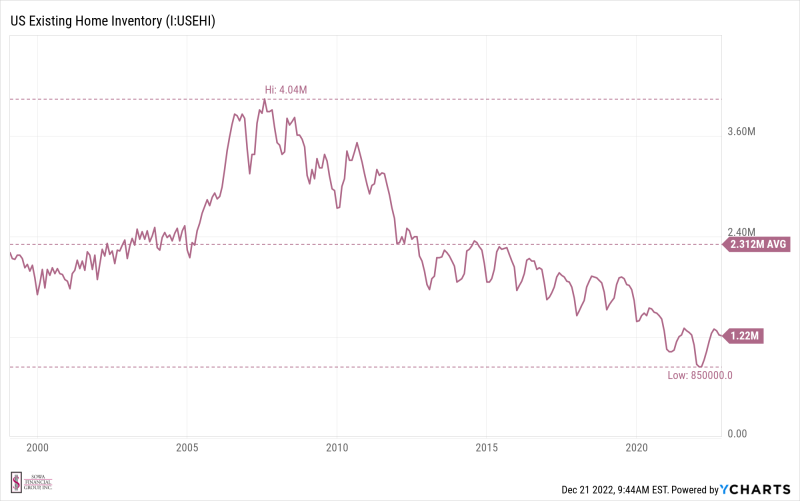
If the 30-year mortgage can get back down under 5% and unemployment doesn’t spike, I think home prices will stabilize. So many people (myself included) are sitting on the sidelines waiting for financing to get less expensive. All markets are driven by supply and demand and the supply of single-family homes is just very low (see chart below), meaning it doesn’t take much demand to prop up the price.
Of course, the asset class that gets most of the attention is equity, which has not been spared this year either. However, there are pockets of stocks that are not looking so bad. The S&P 500 is down 14% this year while the tech-heavy NASDAQ is down 27%. But it’s the Dow Jones Industrial Average that is showing the most resilience as we head into the new year, down only 4%. The reason for this is because the Dow is made up of just 30 stocks and many of its components are having a great year.
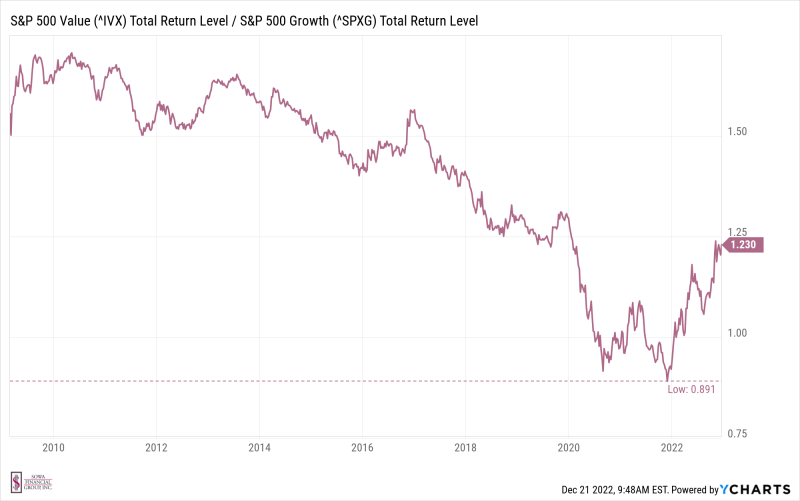
The energy, health care, utilities and consumer staples sectors are all positive on the year. Stocks that are found in these categories tend to have solid cash flows and less debt than sectors like technology. In an inflationary environment, investors typically flock to those companies that have pricing power – meaning that their goods and services are those which customers are less likely to substitute or cut from their budget if the prices rise. These types of securities are sometimes referred to as value stocks and usually pay higher dividends. Below is a chart showing the relative performance of the S&P 500 Value index vs the Growth since the bottom of the 2008/09 market crash. What you’ll notice is that up until 2022, while interest rates were next to zero, growth consistently outperformed value. This will be one of the more closely watched themes of 2023.
For me personally, 2022 was a year of growth and education. During the summer I began studying for a new certification known as the CIMA® (Certified Investment Management Analyst®). I recently passed the exam and am now officially a CIMA® designee. As with the CFP® designation, CIMA® designees are fiduciaries when managing accounts and continuing education is required to maintain the designation. When I shared the news with someone recently, they quipped that I must be able to predict the markets better now. In reality, it is actually the opposite. An in depth look at statistics shows that the discipline itself can be very misleading, and my recent studies have hardened my opinion that no one can predict the future. That being said, there are some interesting historical trends one can look to. For example, this past October (+8%) and November (+5.4%) were very good months for the S&P 500. In fact, it is rare to see consecutive months with that kind of performance. Since 1954 this is the 14th time it has happened. One year following the second month the S&P has been positive every time and positive by a lot; 22% on average.
The level of uncertainty now is as high as it has been in a generation and that is leading to some significant volatility in the markets. At the time of this writing in December, the S&P 500 has seen at least 58 days where it traded down more than 1%. 2008 was the last year with that much intra-day volatility. I recently saw a newspaper cartoon from 1981. It pictured a man watching his television. On the TV set was a news anchor reading from a script. The caption read:
“On Wall Street, news of lower interest rates sent the stock market up, but then the expectation that these rates would be inflationary sent the market down, until the realization that lower rates might stimulate the sluggish economy pushed the market up before it ultimately went down on fears that an overheated economy would lead to a reimposition of higher interest rates.”
The more things change the more they stay the same, I guess.