During late summer of 2008 Tom Brady appeared on the cover of Sports Illustrated Magazine. He was coming off an MVP season where he led the league in passing yards, touchdowns, and completion percentage. He also led the New England Patriots to an unprecedented 16-0 undefeated regular season. But just a few weeks after the SI issue came out, Brady found himself on the injured list with a torn ACL. Many people pointed to the “Sports Illustrated Curse” as the reason why Brady was taken out. There have been many instances where star athletes have appeared on the cover only to have their performance wane shortly thereafter. In August of 1978 Pete Rose graced the cover in the middle of a 44-game hitting streak (the third longest ever). Of course, you can guess what happened next.
Daniel Kahneman, in his famous book Thinking Fast and Slow, gives a very refreshingly simple explanation for the curse: “An athlete who gets to be on the cover of SI must have performed exceptionally well in the preceding season, probably with the assistance of a nudge of luck – and luck is fickle.” Kahneman makes the case that regression to the mean is the real reason for the SI curse.
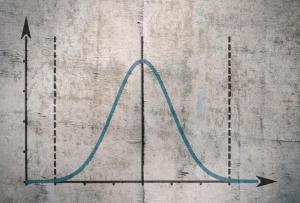
In statistics, regression toward the mean is a concept that refers to the simple fact that if one sample of a random variable is extreme, the next sampling of the same random variable is likely to be closer to its mean. This phenomenon occurs in financial markets as well as sports. For example, over the last 20 years, seven of the best 10 days for stocks occurred within two weeks of the 10 worst days. And six of those seven best days occurred after the worst days. The second worst day of 2020 – March 12 – was immediately followed by the second-best day of the year. This is regression on a micro level.
We can observe regression on a macro level too. Over the last 100 years stocks have returned about 10-11% per year on average. However, some decades have experienced returns well above the average. For instance, in the 1950’s (the best decade for stocks) the market returned 20% per year. We could say that at the start of the 1960’s the stock market was on the cover of SI. So, what happened in the 60’s and 70’s? Below average returns; 7.6% and 5.9% respectively. But my favorite example of regression in the stock market is what happened in the decade following the longest, strongest secular bull market of all time. From 1980 to 2000 stocks averaged 17% per year! The decade following the dot-com bubble saw a negative return of 1.2%, the worst decade on record.
A wise man once told me that markets move in cycles, but people think in straight lines. When things are good, investors believe they will always be good, and when they are bad, they’ll never get better. Regression shows us that the opposite is true. So, when the weather has been great for a long time, pack your umbrella. And when it hasn’t stopped raining for days, you can be sure sunny days are right around the corner.