
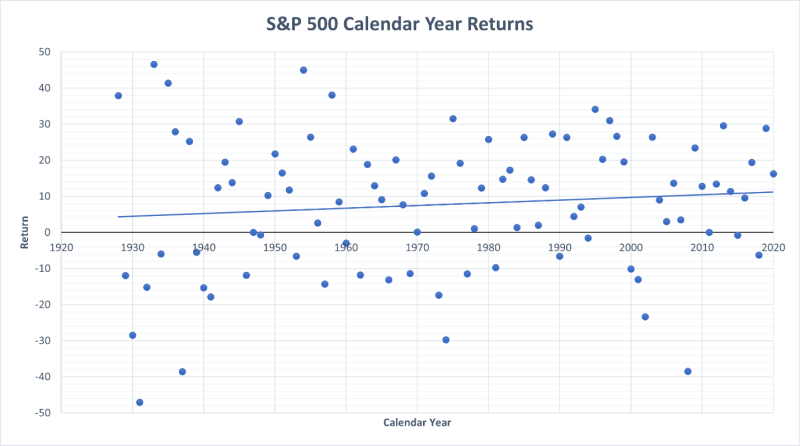
One thing I have learned since entering the finance industry is, math is hard. When it comes to investing, math is often counterintuitive as well. For example, if you were to average every calendar year total return for the S&P 500 since 1928, you would get about 7% or 8% per year. Not bad, but how many of those nearly 100 calendar years returned between 0% and 15%? In other words, how many of those years did a hypothetical investor actually experience a return around 7% or 8% per year? The answer is just 27 of them. The blue line in the chart below shows a linear average of the years. Notice how so many of the dots – representing each calendar year – are so far away from the average.
Compounding interest can also be perplexing. Here, let’s consider the value of the Dow Jones Industrial Average in 1999; the index touched 10,000 for the first time that year and it took over 100 years to do so. The next 10,000 points would happen much sooner; in 2017 the Dow would breach the 20,000 level and just last year (2020) it would reach 30,000.
One of the most common concepts around compounding interest is the Rule of 72. The rule is a simplified formula that calculates how long it will take for an investment to double in value, based on a given rate of return. If you divide the rate into 72 the answer gives you the time it takes (roughly) to double. 72 divided by 6 equals 12, so an investment that earns 6% per year will double every 12 years. Doubling your money sounds great, but keep in mind that it works the same with debt. Compounding interest can work for you or against you.
You don’t have to be a math wiz to understand the fundamentals of finance and investing, but having a basic understanding of how percentages and ratios work can be very helpful when trying to conceptualize topics such as risk and return.